A Visual Search Experiment - Conjunction and Pop-out
I want to go through a simple but interesting psychophysics experiment to measure the reaction time of a human subject to visual stimulation, using just a computer. I will do the experiment myself and analyze the data (so the sample size will be equal to 1), but you can try it for yourself or with some friends by running the codes on your own computer and gathering your own data.
Introduction
In this experiment we will use a type of perceptual task, called Visual search, that is the scan of the visual environment for a target in the presence of distractors. It has been extensively used in psychophysics experiments to study the ability to locate an object.
We will first write a script for the experimental design, and then I will do the experiment myself to gather some data. With that, we will move onto the analysis.
Experimental Design
In the project I use a basic visual search experiment design, and I will shortly describe the experimental procedure here.
Experiment consists of 3 different types of figures for the subject to search for a target; pop-out, conjunction and no-target. The subject is expected to press 2 different keys; one for registering that a target is found, and the other for registering that there is no target in the figure.
Trials
Target Figures
Target is a red circle displayed on the screen along with green circles. There are distraction points plotted as crosses. In the pop-out figures, these crosses are all green, while in the conjunction figures, half of the crosses are green and the other half is red.
No target figures
No target figure does not contain a target - which is a red dot. Subject is expected to press a different key to answer a no target presence.
In each trial - with or without the target - there are an equal number of crosses and circles. These sizes are determined by levels.
Levels
There are 4 levels of difficulty in this experiment; sizes of 4, 8, 12 and 16. In order for the experiment to be an event-related design, these sizes are chosen randomly to be presented to the subject. An example is as follows:
- A size 8 trial of pop-out contains 4 crosses (all green) and 4 circles (1 red - which is the target - and 3 green).
- A size 8 trial of conjunction contains 4 crosses (2 green, 2 red) and 4 circles (1 red - which is the target - and 3 green).
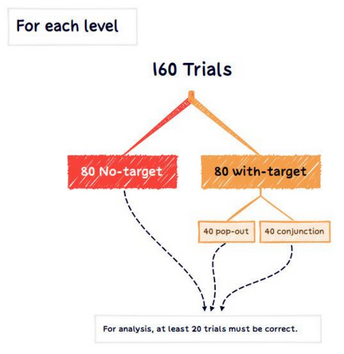 Figure 1 shows for each level, how many trials of varying figures are done. For the analysis, at least 20 correct answers must be present.
Implementation
Since the experiment has a pre-defined scope, we can just go ahead and statically define our plots. I will approach implementing the necessary code in 3 different MATLAB files;
- main.m : To implement and control the parameters and variables of the whole experiment
- trial.m : To handle 1 trial only, including the user input
- plot_controller.m : To handle plotting for each trial of different kinds
In a little more detail, in main script I will control the whole experiment and save the results. It will call trial script for handling a single trial and getting the user input, which will call plot_controller script to handle the plotting. In this manner, let me start with the main.m script.
1
2
3
4
5
6
7
8
9
10
11
12
13
14
15
16
17
18
19
20
21
22
23
24
25
26
27
28
29
30
31
32
33
34
35
36
37
38
39
40
41
42
43
44
45
46
47
48
49
50
51
52
53
54
55
56
57
58
59
60
61
62
63
64
65
66
67
68
clc;clear;clf;

%%%%% SESSION PARAMETERS %%%%%
levels = [4 8 12 16];
level_counter = [160 160 160 160];
sess_data = ["Trial" "Size" "User_Time" "User_Input"];
session_pauser = 100;

%%%% TRIAL PARAMETERS %%%%%
types = ["Pop-out" "Conjunction" "No-target"];
trial_counts = repmat([40 40 80], [length(levels) 1]);
trials = [];

%%%%% STARTING SCREEN %%%%%
clf;
% To make figure fullscreen
figure('units','normalized','outerposition',[0 0 1 1])
% A text before starting trial
g = text (0.3, 0.5, "Press enter to start trials");
% When enter pressed, this while will end
inp = get_input;
while inp ~= 13
    inp = get_input;
end

for i=1:640
    %%%%% STARTING TRIALS %%%%%
    % Choose a level randomly
    curr_level = randsample(levels, 1, true, level_counter/sum(level_counter));
    curr_level_index = find(levels == curr_level);
    % Reduce chosen trial number by 1
    level_counter(curr_level_index) = level_counter(curr_level_index) - 1;

    % Get remaining trial counts for that level
    curr_level_counts = trial_counts(curr_level_index, :);
    % Choose a random trial
    curr_trial = randsample(types, 1, true, curr_level_counts/sum(curr_level_counts));
    % Reduce chosen trial number by 1
    curr_level_counts(find(types == curr_trial)) = curr_level_counts(find(types == curr_trial)) - 1;
    trial_counts(curr_level_index, :) = curr_level_counts;

    % Clear and focus user with center X
    plot_controller("Focus", curr_level)

    % Run trial
    [trial_time, trial_input] = trial(curr_trial, curr_level);
    % Save data
    sess_data = [sess_data; curr_trial curr_level trial_time trial_input];

    % A break every 100 trials
    if mod(i, session_pauser) == 0
        clf;
        g = text (0.3, 0.5, string(640 - i) + " trials remaining, enter to continue");
        % When enter pressed, this while will end
        inp = get_input;
        while inp ~= 13
            inp = get_input;
        end
    end
end

% Save trial data
writematrix(sess_data, "session_data.csv")

function inp = get_input
    k = waitforbuttonpress;
    inp = double(get(gcf,'CurrentCharacter'));
end
This is a basic experimental design and what you may realize on first glance is that the script starts by defining the necessary variables, and runs a for loop for the experiment, presenting the stimuli one-by-one. You may have noticed that I randomly jump between the trial types and levels, i.e. target/no target of level 4 or 8 might follow each other. Although going through the levels incrementally (first level 4, than 8, 12 and 16) might be argued to be a more valid approach, I completed the experiment in randomly presented stimuli within this experiment. If you want to, you can implement that structure using nested for loops easily within the same code.
Another thing to note is I added a break every 100 trials that stops the experiment and resumes when the enter key is pressed, which is solely for taking a small rest. In an incrementally presented stimuli, this break might better be put between the levels.
For controlling the user input in each trial, below is the trial.m script.
1
2
3
4
5
6
7
8
9
10
11
12
13
14
15
16
17
18
19
20
21
22
23
24
25
26
27
function [user_time, user_input] = trial(type, size)
    %%%%% GRAPH CONTROL %%%%%
    plot_controller(type, size)

    % Time user input
    [user_time, user_input] = input_handler;
end

%%%%% USER INPUT HANDLER %%%%%
function [time, answer] = input_handler
    tic

    % space: 32, enter: 13
    k = waitforbuttonpress;
    inp = double(get(gcf,'CurrentCharacter'));

    time = toc;

    switch inp
        case 13
            answer = "Target";
        case 32
            answer = "No-target";
        otherwise
            answer = "Invalid Input";
    end
end
The function trial just passes the arguments to plot_controller, but after that, it measures the time the user takes to respond to the stimuli. I implement that using the input_handler method, and define enter and space keys for the user to say either a target has been seen, or no target is present in the screen. Any other input type will be invalid, and excluded in the analysis.
Lastly, lets look at the plotting script.
1
2
3
4
5
6
7
8
9
10
11
12
13
14
15
16
17
18
19
20
21
22
23
24
25
26
27
28
29
30
31
32
33
34
35
36
37
38
39
40
41
42
43
44
45
46
47
48
49
50
51
52
53
54
55
56
57
58
59
60
function plot_controller(type, size)
    clf;
    if type == "Pop-out"
        circles = rand(2,size/2-1)*5;
        crosses = rand(2,size/2)*5;
        one_true_ring = rand(2,1)*5;

        s1 = scatter(circles(1,:), circles(2,:), 200, "green", ...
                    "linewidth", 2);
        hold on
        s2 = scatter(crosses(1,:), crosses(2,:), 200, "green", ...
                    "linewidth", 2);
        s2.Marker = 'x';
        hold on
        s3 = scatter(one_true_ring(1,:), one_true_ring(2,:), 200, "red", ...
                    "linewidth", 2);
        axis off;
    elseif type == "Conjunction"
        circles = rand(2,size/2-1)*5;
        one_true_ring = rand(2,1)*5;
        red_crosses = rand(2,floor(size/4))*5;
        green_crosses = rand(2,ceil(size/4))*5;

        s1 = scatter(circles(1,:), circles(2,:), 200, "green", ...
                    "linewidth", 2);
        hold on
        s2 = scatter(red_crosses(1,:), red_crosses(2,:), 200, "red", ...
                    "linewidth", 2);
        s2.Marker = 'x';
        hold on
        s3 = scatter(green_crosses(1,:), green_crosses(2,:), 200, "green", ...
                    "linewidth", 2);
        s3.Marker = 'x';
        hold on
        s4 = scatter(one_true_ring(1,:), one_true_ring(2,:), 200, "red", ...
                    "linewidth", 2);
        axis off;
    elseif type == "No-target"
        circles = rand(2,size/2)*5;
        red_crosses = rand(2,ceil(size/4))*5;
        green_crosses = rand(2,floor(size/4))*5;

        s1 = scatter(circles(1,:), circles(2,:), 200, "green", ...
                    "linewidth", 2);
        hold on
        s2 = scatter(green_crosses(1,:), green_crosses(2,:), 200, "green", ...
                    "linewidth", 2);
        s2.Marker = 'x';
        hold on
        s3 = scatter(red_crosses(1,:), red_crosses(2,:), 200, "red", ...
                    "linewidth", 2);
        s3.Marker = 'x';
        axis off;
    elseif type == "Focus"
        s = scatter(2.5, 2.5, 200, "black", "linewidth", 2);
        s.Marker = 'x';
        axis off;
        pause(1) % Sleep half second to make person look on the dot
    end
end
You will see that every trial type is statically defined. I can hear some enthusiastic programmers saying this could be programmed more dynamically, but it would reduce the time it takes for the experimenter to intervene in any part of the plot, i.e. changing color of stimuli is easier in a statically typed script. Having said that, this script is a straightforward one defining plots for each trial type.
To sum up what these scripts accomplish, the user is first presented with a screen before starting the experiment. When enter is pressed, the experiment starts. As mentioned above, the levels are chosen randomly. For each level, a random type of plot (pop-out, conjunction or no-target) is chosen. Both random choices are done using weights calculated by the remaining counts for levels and types of plots regarding those levels. After these random choices, the related figure is displayed to the subject. The subject is expected to press Enter if the target is present, or Space if the target is not present. Between each figure, a black cross in the middle is presented to the subject, with the aim to focus the subject to the middle of the figure. This focus cross stays on the screen for 1 second, then the next figure is presented. After every 100 trials, a pause screen is shown for the subject to take a rest. Pressing enter will then continue the trial. A total of 640 trials are expected to be done for the subject to finish the session.
Results
Keep in mind that following results are for 1 subject (that is me). This subject answered 624 correct trials out of 640, which gives a 97.5% of true answers. So the data can be taken for analysis. If many of the data were to contain false answers and invalid inputs, we could conclude that the subject was inattentive, thus could exclude that subject from analysis.
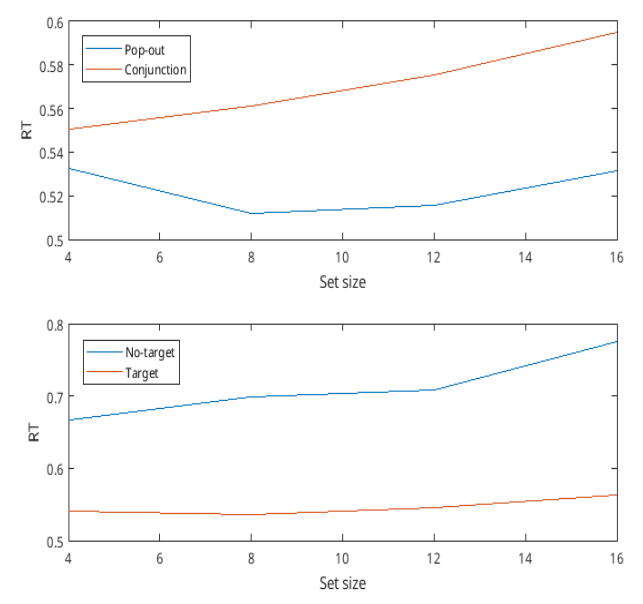 Figure 2: Reaction times for the experiment
Target trials
Slopes
In the upper figure of Figure 2, mean response times for target-containing trials are shown. As expected, mean response times for conjunction increases with increasing levels, with a slope - of first degree polyfit - around 0.004. On the other hand, pop-out seems to be randomly changing across different levels, but follows somewhat more of a line, which can be seen in pop-out slope, that is around 0.
This outcome was expected as in pop-out trials, the target has a unique feature compared to the other stimuli, and can easily be detected. On the contrary, in conjunction search trials, the target has no distinct features from the distractors, reducing the efficiency in regards to reaction time (RT). As the distractors represent the differing individual features of the target more equally amongst themselves (distractor-ratio effect), reaction time (RT) increases and accuracy decreases.
Pearson Correlations
Pearson correlation between mean reaction times and set sizes (levels) for conjunction trials is 0.99, which shows that as the level increases, mean time is expected to get larger. Thus we reject the null hypothesis that mean times do not relate to set sizes (p < 0.01).
No-target vs target trials
Bottom figure of Figure 2 shows target and no target mean time responses for the session. For no target trials, as expected, the response times are bigger than the target trials. That is thought to be due to the subject searching the target, and not finding, takes more time.
Slope of no target trials is bigger than conjunction trials, with a positive value of 0.009. Pearson correlation for no target values with respect to set sizes is around 0.94, from which it can be concluded that increasing set size does increase no target response of the subject. So we can reject the null hypothesis for the no target trials (p < 0.05).
References
- Matlab for Neuroscientists. (2009). Elsevier. https://doi.org/10.1016/b978-0-12-374551-4.x0001-2
- Shen, J; Reingold, EM; Pomplun, M (June 2003). “Guidance of eye movements during conjunctive visual search: the distractor-ratio effect”. Canadian Journal of Experimental Psychology. 57 (2): 76–96. CiteSeerX 10.1.1.59.251. doi:10.1037/h0087415. 12822838.
- Eimer, M; Grubert, A (October 2014). “The gradual emergence of spatially selective target processing in visual search: From feature-specific to object-based attentional control”. Journal of Experimental Psychology: Human Perception and Performance. 40 (5): 1819–31. doi:10.1037/a0037387.) 24999612.
Appendix - Distribution of Response Times
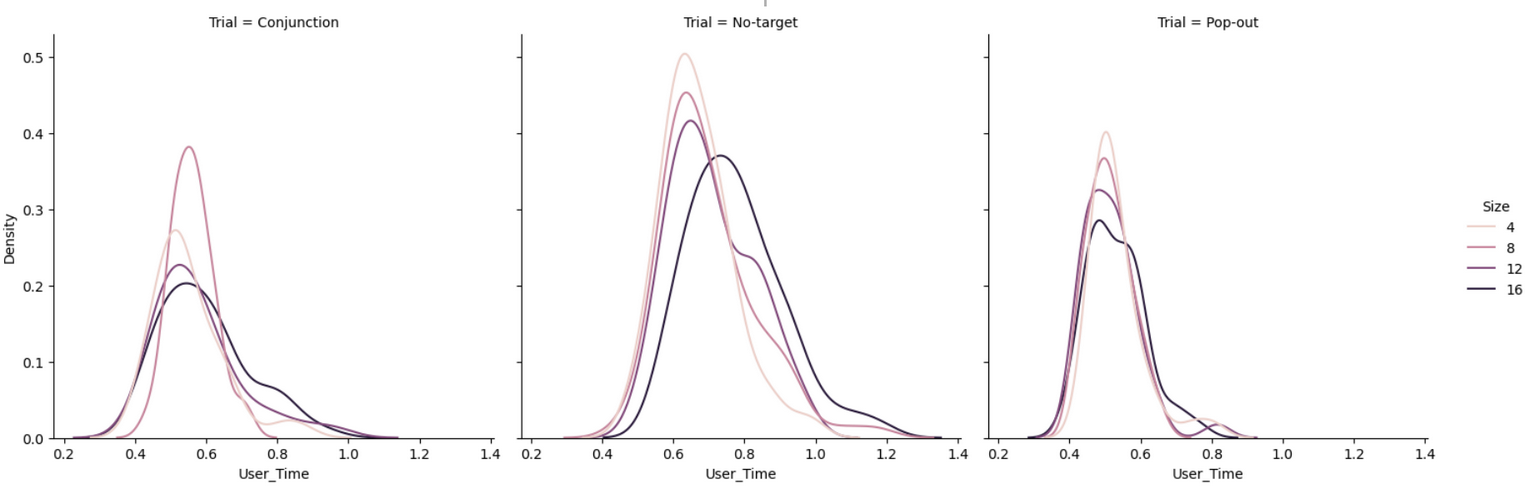
All response times distributions shown seem to be normally distributed. Though no target responses have a slight skew to the right, compared to other trials. Also with respect to increase in size, all curves are spread wider, which is expected since the difficulty increases but at random times, the dot is either easier to find, or harder. So both lower and higher response times can be seen more commonly when the difficulty, that is the set size, increases.