Subject Judgement on Visual Stimuli Presence
In my previous post, Determining Visual Thresholds, we measured a threshold of detecting visual stimulus of pixels of different brightness levels (absolute threshold). Building upon the code of this previous project, here we will also ask the subject how certain they are of their answer. Subject judgement is a criterion, an internal response as opposed to behavioral response, which would be judging if the pixel is present or not. In the analysis, we will use a ROC curve to determine this internal criterion.
I will again be the subject for studying this topic, but I highly encourage anyone interested to take my previous codes, and do the experiment yourself with your friends and family in order to better generalize the results.
Experimental Design
First it is important to note that trials in this experiment should be done in a dark environment and the distance of the head to the screen should be constant. Also screen brightness should be kept the same across trials in order to avoid overall change in the brightness of the pixels.
The subject is asked to press a button if they are able to see the target, and press another button if they do not, as before in the psychophysics experiment. There is also another input taken from the subject this time, which is the rate of certainty of subject where subject rates how confident they are that a pixel is present or not, scaled from 1 (not certain at all) to 9 (very certain).
After the trials, we get 2 distributions of certainty; one for stimulus present and other for stimulus not present. Using these 2 distributions, we can assess the criterion of the subject.
Implementation
Note that trials are done at night, without lights to create a dark environment and the subject was held at a roughly constant distance to the screen.
The code is the same as the previous study, so I will not be sharing it here. Only addition to the code is taking another input for each stimulus, of how certain the subject is, which is a number from 1 to 9 as described above.
Subject was presented with a fixation pixel in the center of the screen, with full brightness (value of 255). Another point was placed 40 pixels to the right of the fixation point with a varying brightness of 0 to 60 in increments of 5. Subject were asked to first press dot (.) if they see the point or comma (,) if they do not, then the subject was asked to predict the brightness of the pixel in ranks of 1 to 9. This is contradictory to what is explained above, but it is intentional. I have decided to conduct the experiment this way, because by asking the question of ranking the brightness values one after another, the subject now enters a lower confidence value if the brightness of pixel is low, and a higher value if the brightness is high (dot is visible - easily visible).
The reason brightness values of 0 to 60 is chosen is because in the previous study, we have obtained the absolute threshold for different distances from the center and for 40 pixels, the value was between 35 to 40. So by choosing 0 to 60 interval, I assume that some brightness values will fall below the absolute threshold where the subject cannot see any dot on the screen (to the right of the center of course) and some will fall above the threshold so that the subject will be certain that s/he sees the dot.
Results
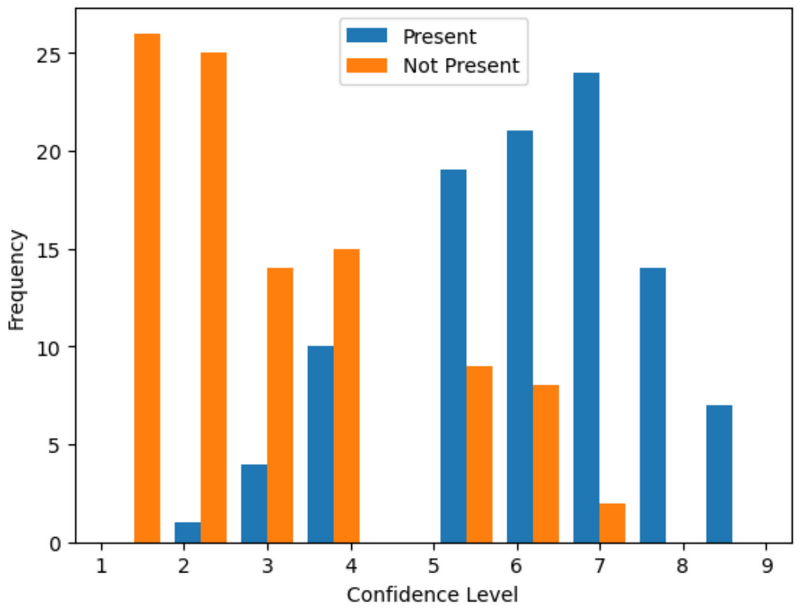 Figure 1: Histogram of frequencies of subject confidence
After the trial, I first plot the confidence levels reported for trial type (target pixel present or absent). Figure 1 shows the clear distinction between these 2 groups at a first look. But what value can be thought to be the subject’s internal criterion?
In order to find the internal criterion, I first plot the probability density function (pdf) of these 2 groups. Figure 2 shows pdf for both groups and what may be thought to be the internal criterion of the subject.
The internal criterion of an observer can be found by taking the maximum vertical distance of the ROC curve to the x=y line.
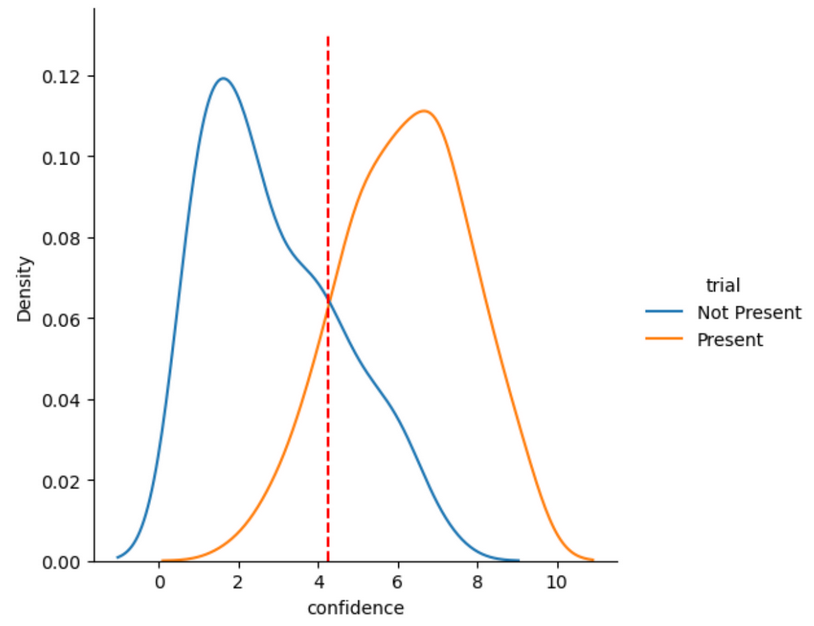 Figure 2: Probability distribution plot of confidence values and a candidate for subject criterion in red dashed line.
I constructed pay-off matrix using this trial data, which is table 1, where we can numerically see hit, false alarm, miss and correct rejection values, table. This table is constructed by using the absolute threshold value that is calculated in the psychophysics experiment, where brightness values below the threshold are thought to be absent while brightness of above the threshold value was taken to be present. I call this data column trial type and I compare it to what the subject reported (either they reported they see it or not).
| Stimulus Present | Stimulus Not Present | Total | |
|---|---|---|---|
| Reported Present | 71 (.355) | 12 (.06) | 83 |
| Reported Not Present | 29 (.145) | 88 (.44) | 117 |
Table 1: Payoff matrix of results and their percentages in parenthesis. This table is constructed using the criterion value plotted in figure 2.
From the table, we see that the subject has done the trial without too much errors, so we can analyse the data. To construct the ROC curve (or receiver operating characteristic curve), we basically create many of these tables for many criterion values. More technically, I take 500 points spaced equally between 1 and 9 and check how many of the subject confidence levels fall above those criterion values for both of the groups. The reason we need to take the values above the criterion values is for ROC curve we want to plot false alarms vs hit rate, and in order to do that, we basically take the first row of table 1, where the subject has reported the target pixel to be present.
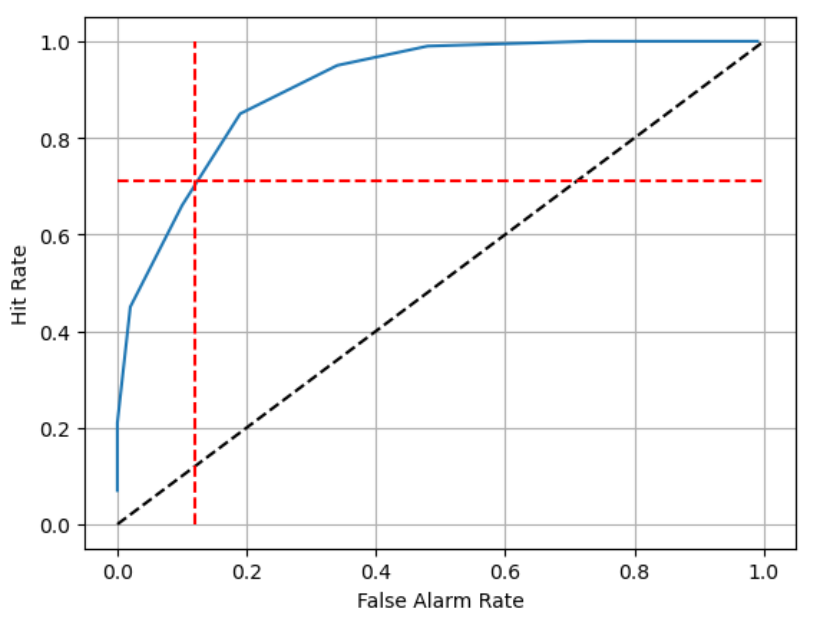 Figure 3: ROC Curve with mentioned criterion level plotted.
Figure 3 shows the ROC curve and the aforementioned candidate for the internal criterion value. It is clear by eye that this criterion value is not the internal criterion of the observer, since it is not the furthest distance from the x=y line. But from this ROC curve, we can calculate the maximum distance to the x=y line to find the optimal criterion value for the subject (note that criterion values are chosen in accordance to the needs in real life - for ex. we may want to reduce false alarms so we would take a different criterion).
Area under the ROC curve is calculated as approximately 0.90 while the area under the diagonal reference line is 0.5. This shows that the observer was very sensitive during this trial. We could increase the hit rate which would shift criterion to the left (lower confidence value) rewarding the observer for hits. Note that it would also reduce true rejections.
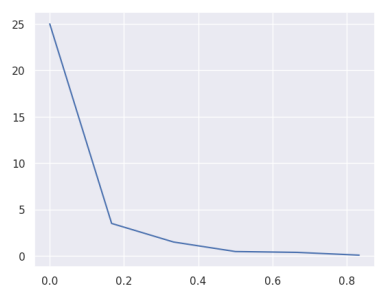 Figure 4: Slope of the ROC curve.
Figure 5 shows the optimal criterion value both on the pdf plot and the ROC curve plot. So I conclude that this is the internal criterion value for this subject. By adjusting this criterion, we could increase hit rate, which would decrease true rejections. So if we were to reward the observer for hits, observer’s criterion may shift to the left even more to be able to maximize their hit rate.
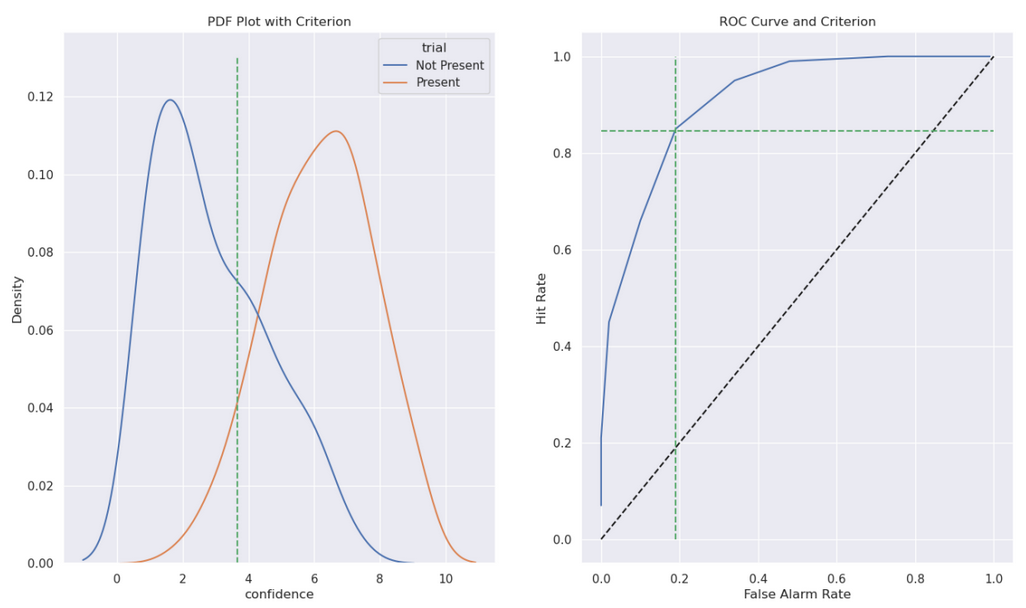 Figure 5: Optimal criterion, which can be taken as the subject’s internal criterion.
Mean Difference Between Groups and $d’$
The mean difference of confidence levels of groups Present and Not Present is calculated as 3.30.
$d’$ is defined as the distance between the means of the two distributions normalized (divided) by the joint standard deviation of the two distributions. The pooled standard deviation of these groups is calculated as 1.64, and so
\[d' = \frac{3.30}{1.64} = 2.01\]$d’$ can be increased by a bigger stimulus which would increase the effect size, separating the means of both curves even further, resulting in an increase in value of $d’$. Also, making the experiment foveal rather than parafoveal should also increase the effect size, thus increase $d’$.
References
- Matlab for Neuroscientists. (2009). Elsevier. https://doi.org/10.1016/b978-0-12-374551-4.x0001-2
- Ethem Alpaydin. 2010. Introduction to Machine Learning (2nd. ed.). The MIT Press.
- Fawcett, Tom (2006). “An Introduction to ROC Analysis”. Pattern Recognition Letters. 27 (8): 861–874. doi:10.1016/j.patrec.2005.10.010.